I have decided to not focus on Binaural Microphones now. This is because I could not think of a good enough project to reflect the capabilities of Binaural Microphones well enough. I have now decided to focus on Data Visualization. Data Visualization is quite literally a visual representation of data. This can be any form of data visualization, from a map to a graph. In my case, I am going to focus data visualization for entertainment and music purposes.
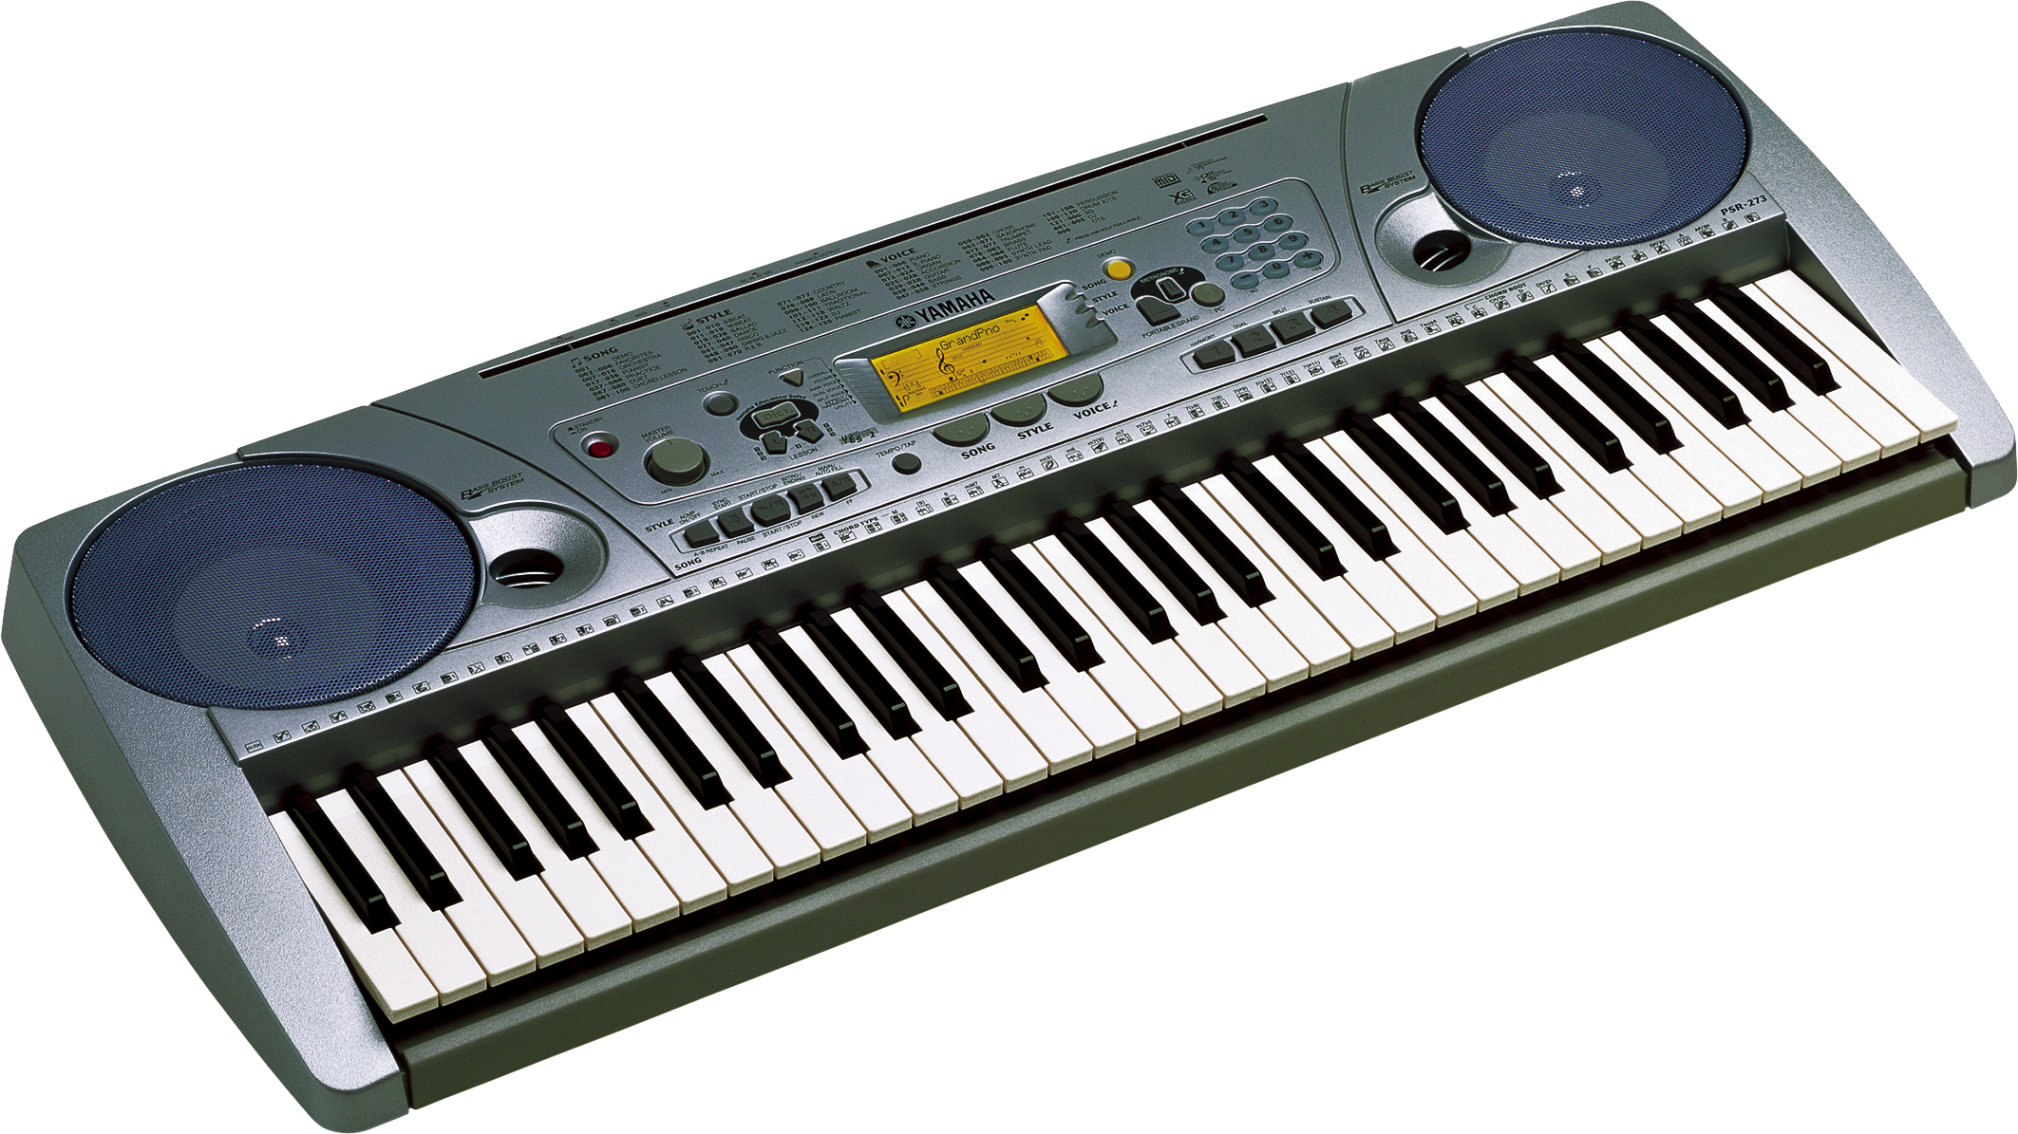 |
| Yamaha PSR 273 |
My idea is to focus on using LEDs as a Data Visualization with a MIDI keyboard. I got this idea from the Yamaha PSR273 Keyboard that already has a similar feature. I actually used this keyboard to make a music video for Media Studies A2. The visual representation of lights, that was triggered when a note was played, was brilliant. See video below to understand what I am discussing.

No comments:
Post a Comment